Complete guide to integrate X-Debug into PhpStorm for XAMPP
This post is a continuation of the guide to installing X-Debug on MacOS X. Please refer to the former post to install the X-Debug first.
To integrate X-Debug into PhpStorm IDE, please follow the following steps:
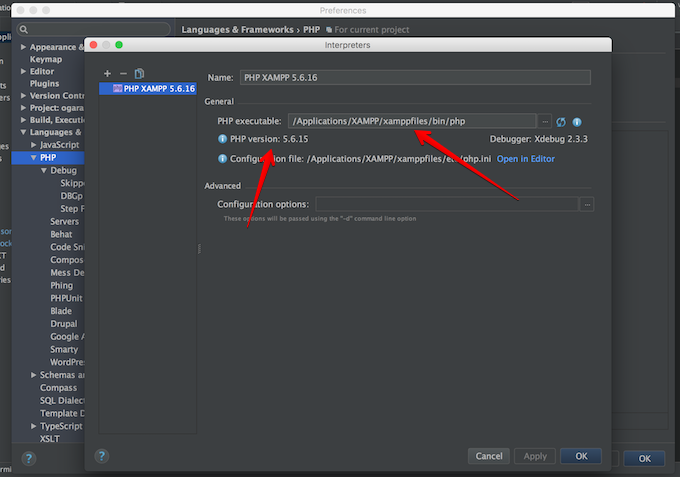
1. Go to PhpStorm → Preferences → Languages & Framework → PHP
2. Set your php interpreter for debug. You can either add a default interpreter or create a custom one. This is where the command you used to know (which Php interpreter you are using) comes in handy.
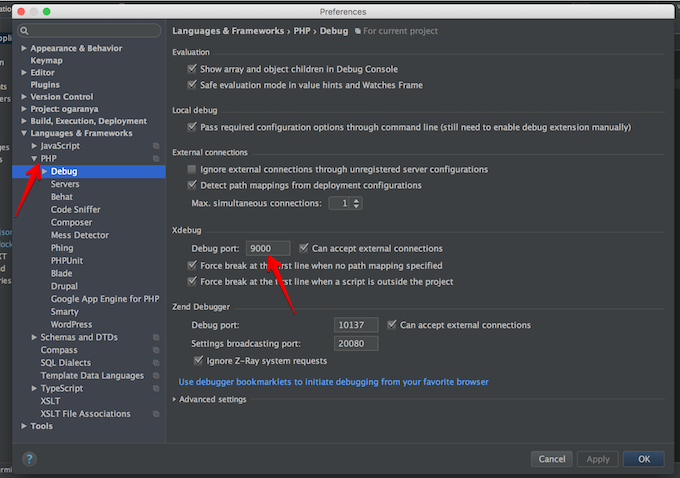
3. You can go to Go to PhpStorm → Preferences → Languages & Framework → PHP → Debug to be sure your port is the same as specified.
4. If you are testing from Postman or you are testing your api, just add parameters to your call to help X-Debug pick the instance. Below is the parameter.
XDEBUG_SESSION_START=PHPSTORM (where PHPSTORM is your Ide key)
For a GET call do this http://domain.mine/whatever?test=1234&XDEBUG_SESSION_START=PHPSTORM
For POST add to your post parameter XDEBUG_SESSION_START=PHPSTORM
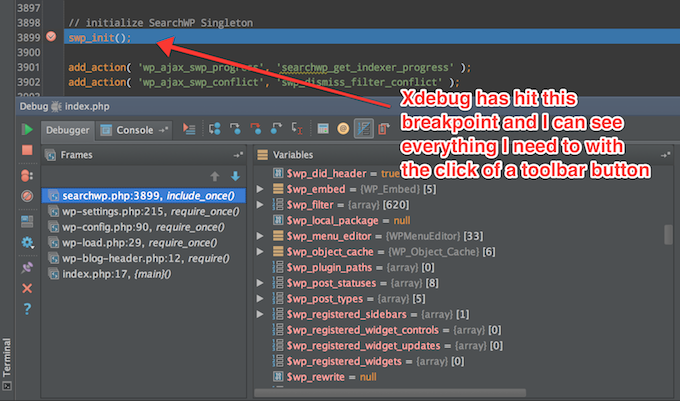
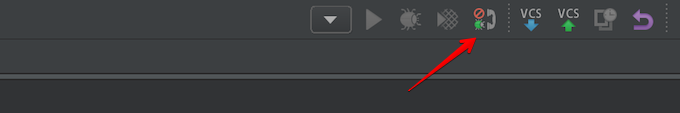
5. Start your debugger.
6. Run your code
How to use PhpStorm for debugging your php code is a post for another day...I hope this recent post gets someone out of problem.
Troubleshooting
Are you having trouble debugging? Is PHPStorm not recognising your project path? It is easy, just ensure that you are not passing /Applications/XAMPP/htdocs/ as your project root. XAMPP syncs your files to /Applications/XAMPP/xamppfiles/htdocs/. So, here is your real path /Applications/XAMPP/xamppfiles/htdocs/ and let it point to your project's entry point.
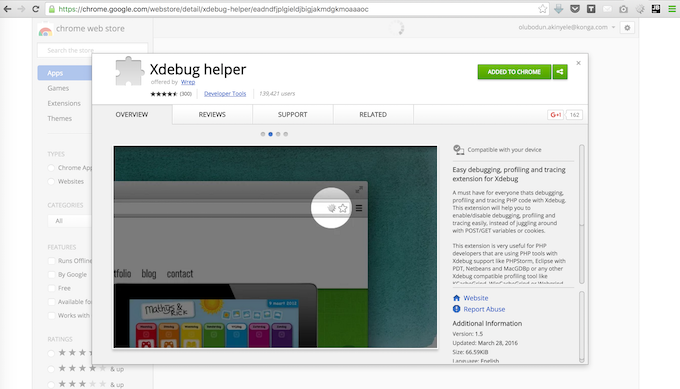
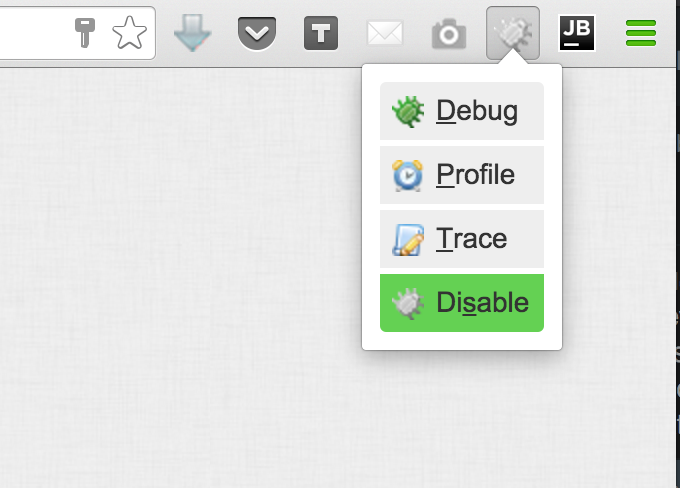
X-Debug for the web
Download and install the chrome web broswer plugin https://chrome.google.com/webstore/detail/xdebug-helper/eadndfjplgieldjbigjakmdgkmoaaaoc and also install the jetbrain plugin for Chrome web browser from here: https://chrome.google.com/webstore/detail/hmhgeddbohgjknpmjagkdomcpobmllji. Set your X-Debug chrome web browser plugin to be enabled and you will be fine.